
What Are Project Management Tools?
Project management tools have become an integral part of software engineering, providing a structured approach to planning, organizing, and managing software development projects. These tools help software development teams streamline their workflows, improve collaboration, and ensure that projects are completed on time and within budget.
In recent years, advancements in technology have led to the development of sophisticated project management tools that offer a range of features, including task management, scheduling, resource allocation, and project tracking. This has made it easier for software development teams to manage complex projects and collaborate effectively, even when team members are located in different parts of the world. In this context, it is essential to explore the different project management tools available to software development teams and understand how they can help improve the software development process.
Best Project Management Tools
Want to know Software Project Management Tools and their specialties? then check out the below section to know the most commonly used Project Management Tools.
- Gantt Chart
- PERT Chart
- Logic Network
- Resource Histogram
- Critical Path Analysis
- Product Breakdown Structure
- Work Breakdown Structure
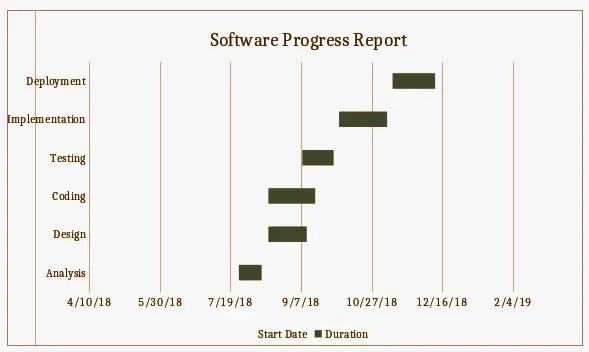
Gantt Chart
The Gantt chart is a classic project management tool that has been used since its development by Henry Gantt in 1917. It remains a popular and effective way to visualize activities against time, with each activity represented as a bar on the chart. In software engineering, Gantt charts are particularly useful for providing an overview of one or multiple projects, enabling stakeholders to view which tasks are dependent on one another and what events are coming up.
By displaying the entire project landscape, Gantt charts help teams to plan and organize their work effectively, identifying potential bottlenecks and scheduling resources appropriately. Overall, Gantt charts remain an important part of software engineering project management, helping teams to stay on track and deliver high-quality software on time and within budget.
PERT Chart
PERT, short for Programme Evaluation Review Technique, is a network diagram used in project management to visualize the interdependencies between various project tasks. PERT was initially developed by the U.S. Navy in the 1950s to manage the Polaris submarine missile program.
In a PERT chart, each task is represented by a node, and the direction of the lines indicates the sequence of the tasks. Dependent or serial tasks must be completed in a specific order, whereas parallel or concurrent tasks can be undertaken simultaneously. To represent the fact that a task must be completed before another can begin, a dotted line known as a “dummy activity” is used. PERT charts do not show resource or completion time; instead, they focus on event dependency, i.e., which events must occur before others can start.
Overall, PERT charts help project managers visualize the entire project landscape and plan the project timeline accordingly, ensuring that each task is completed in the appropriate order. By identifying dependencies and potential bottlenecks, PERT charts enable project teams to manage their work effectively and deliver high-quality software on time and within budget.

Logic Network
A Logic Network is a visual representation of the order of activities to be completed over time. Its primary purpose is to show the sequence in which activities must be performed, making it an essential tool for distinguishing events and mapping out the project timeline. By visualizing the dependencies between tasks and the overall project workflow, the Logic Network helps project managers to better understand the scope of the project and develop a realistic timescale for completion. This allows teams to plan and allocate resources effectively, ensuring that each task is completed on time and that the project as a whole stays on track. Overall, Logic Networks play a crucial role in project management, providing an organized and structured way to visualize complex projects and manage the project timeline effectively.
Resource Histogram
A Resource Histogram is a type of bar chart used in project management to display the amount of time that a specific resource is scheduled to work on a particular task or project over a defined period. This graphical representation allows project managers to quickly and easily view the resource allocation across the project timeline, making it easier to identify potential resource constraints or availability issues. Resource histograms can also include the related feature of resource availability, allowing project managers to compare the planned resource allocation with the actual resource availability. This enables project teams to identify and resolve resource allocation issues early, ensuring that projects stay on track and within budget. Overall, resource histograms are an essential tool for managing project resources effectively, providing project managers with the information they need to allocate resources appropriately and deliver high-quality software on time.
Critical Path Analysis
Critical Path Analysis, also known as the Critical Path Method, is a project management technique that involves identifying and organizing the sequence of activities required to complete a project, as well as determining the time required to complete each activity and the relationships between them. The critical path is the sequence of tasks that must be completed on time in order to ensure that the project is finished by the required deadline. By identifying the critical path, project managers can more accurately predict whether a project will be completed on time or if delays are likely to occur. This allows project teams to make adjustments to the project timeline or resource allocation as needed to keep the project on track.
Overall, Critical Path Analysis is an essential tool for project managers, helping them to effectively plan and manage complex projects and ensuring that projects are completed on time and within budget.
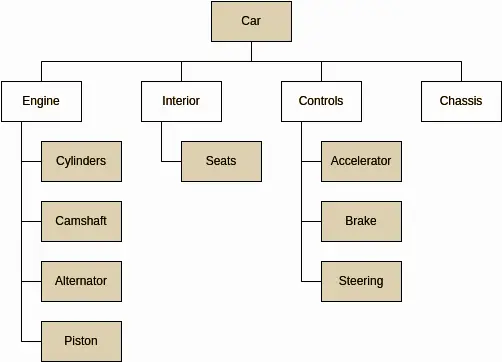
Product Breakdown Structure (PBS)
The Product Breakdown Structure (PBS) is a fundamental tool used in project management to help break down a project into smaller, more manageable components. It is a task-oriented system that provides a detailed description of the subtasks or work packages involved in a project and illustrates how they are interrelated. The PBS includes various types of lists and diagrams that visually represent the project work, enabling project managers to more effectively understand and organize the complex tasks involved. The PBS is similar to the Work Breakdown Structure (WBS), which also provides a hierarchical breakdown of a project’s tasks and subtasks. Overall, the PBS plays a critical role in project design, enabling project teams to more efficiently and effectively complete project work, and ensuring that projects are completed on time and within budget.
Check out the PBS with an example from the below image.
Work Breakdown Structure
The Work Breakdown Structure (WBS) is a crucial project management deliverable that organizes the work of the project team into manageable and flexible segments. The Project Management Body of Knowledge (PMBOK) defines the WBS as a “deliverable-oriented hierarchical breakdown of the work performed by the project team.” There are two primary methods for creating a WBS: the top-down approach and the bottom-up approach.
- In the top-down approach, the WBS is derived by breaking down the overall project into smaller sub-projects or lower-level tasks.
- The bottom-up approach is more like a brainstorming session, where team members are asked to identify and list the low-level tasks required to complete the project.
Both methods have their advantages and disadvantages, and the choice of approach will depend on the specifics of the project at hand. Ultimately, the WBS is a critical tool for project managers, as it helps ensure that project work is completed on time, within budget, and to the expected quality standards.
Have you gathered the necessary information about the Project Management Tools that we have provided here? then what you are waiting for! browse our website tutorials.freshersnow.com daily for more useful articles.